Background
There are many cool things about Game of Thrones. If dragons, gore and incest aren’t reason enough to pique your interest, its frequent ‘WTF’ moments should be enough to create any fan.
However when I try and explain the appeal of the show to ‘non-throners’, many baulk at the sheer number of characters that are part of it. Fair enough. There are almost 800 characters in the entire ‘A Song of Ice and Fire’ (ASOIAF) saga and a lot of these relationships are explored with narrative heavily laden with exposition, which can be off putting. Subsequently, buying into GoT can feel a little cumbersome for noobs.
Cue this project!
Having found an amazing data set online curated by Andrew Beveridge - I decided to use some network science techniques to explore all the characters in the ASOIAF saga and their relevant connections with one another. But first let’s get under the skin of what a network is…
What is a network?
A network is a series of nodes, connected by edges. If you spend a lot of time in London you will be familiar with a network which well represents this relationship between node and edge.
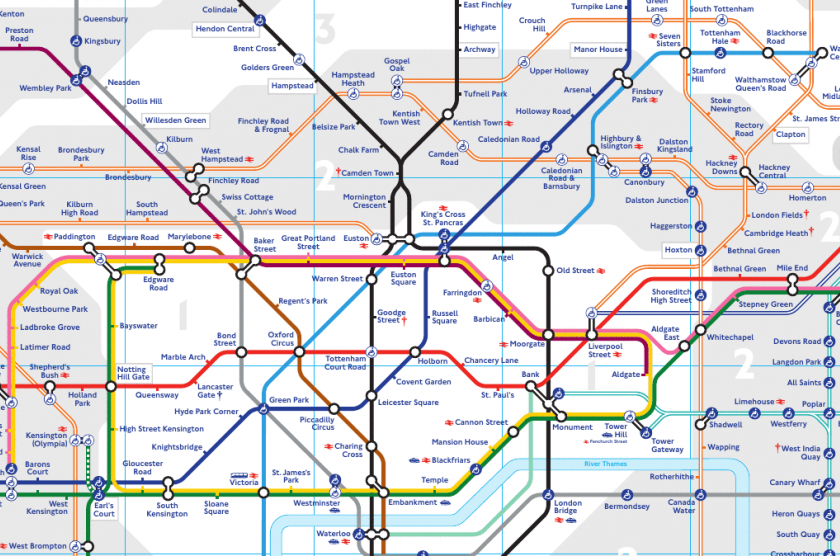
The London Underground has stations (nodes) and lines (edges) that connect those stations.
Collectively, all the nodes and edges represent a network much like all the stations and lines of the Underground represent the tube network.
Some stations have more lines connecting them to other stations than others. Kings Cross has six lines connecting it whereas somewhere like Angel is only served by one. Some stations are only accessible through certain lines. For example you can only get to Old Street using the Northern Line whereas London Bridge can be accessed by the Northern Line or the Jubilee Line.
As you can see, nodes and edges are simple concepts but can very quickly become nuanced and this provides the network with its unique shape and function.
A Game of Networks
Nodes and edges need not be limited to geography. The London Underground is a very ‘tangible’ example of a network however we can apply the same thinking to more abstract networks such as the relationships between individuals - which was what I attempted with this project.
Using network science techniques we can explore how all the characters in the ASOIAF saga are connected. We can explore who has the most connections, who is connected to who and we can also work out who hasn’t met yet. We can attempt to quantify what loyalty or commitment mean in a network. We can also use techniques to determine what aspects of a character infer ‘importance’ in a story.
Exploring the nodes
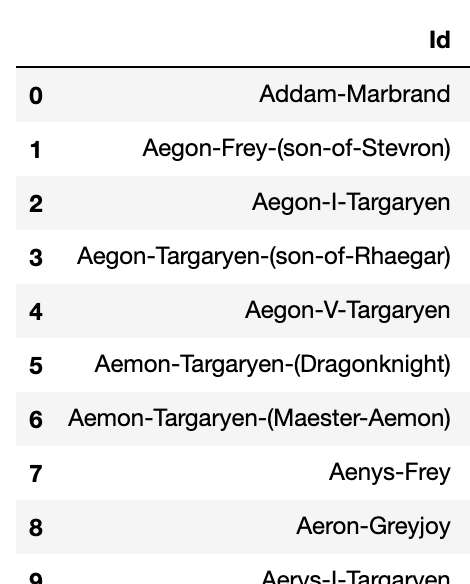
The node data in the ASOIAF data set is fairly simple. It consists of a series of unique characters from GoT - all 796 of them.
The edge data consists of each connection between any given character and another character. The original author of this data set Andrew Bevidge explains how he structured the edge data:
These networks were created by connecting two characters whenever their names (or nicknames) appeared within 15 words of one another in one of the books in “A Song of Ice and Fire.”*

In addition to the connections between characters, each connection has a ‘weight’ field:
The edge weight corresponds to the number of interactions.
Some characters have more interactions throughout the saga. If we look at Jon Snow’s interactions, we see some of the greater weightings make sense, Sam and Jon appear together frequently. They have one connection but have had multiple interactions with each other.

Weight is explored in more detail later on.
Building the first graph
We will use the networkx library to build the graph. We will create an instance of a graph class and then add to it the node, edge and weight data.
I’m going to use plotly to visualise the network. I really like plotly - the syntax needs getting used to but it can create some really nice looking visualisations. It also has super useful tools that will help us explore the network interactively. The nodes have been colour coded to denote the different houses (only the more common ones) so it’s easier to identify who is who e.g House Targaryen in red, House Stark in light-blue.
There are many different layouts you can use to visualise a graph. In this instance I prefer using Force-directed algorithms. Networkx has the Kamada-Kawai algorithm built in so we can use that. From Wikipedia..
Force-directed graph drawing algorithms are a class of algorithms for drawing graphs in an aesthetically-pleasing way. Their purpose is to position the nodes of a graph in two-dimensional or three-dimensional space so that all the edges are of more or less equal length and there are as few crossing edges as possible, by assigning forces among the set of edges and the set of nodes, based on their relative positions, and then using these forces either to simulate the motion of the edges and nodes or to minimize their energy
(to navigate around the plot click and drag an area to zoom in. Double tap or double click to zoom out again)
Now we have built and plotted the first graph we can look at some key metrics that are frequently used to describe the structure of network: A node’s degree and a node’s betweeness centrality.
Graph Metrics
Exploring what Degree is
The degree of a node indicates how many edges a node has. In the context of the GoT data we are using, the degrees represent the number of narrative connections characters have with one another. A character with a high degree is someone that gets mentioned in context with a lot of other characters i.e. probably someone who is likely to be quite important. A character with a low degree is someone that doesn’t have many interactions with other characters - we could possibly assume this character doesn’t play a significant role.
Let’s explore this with a simple example.
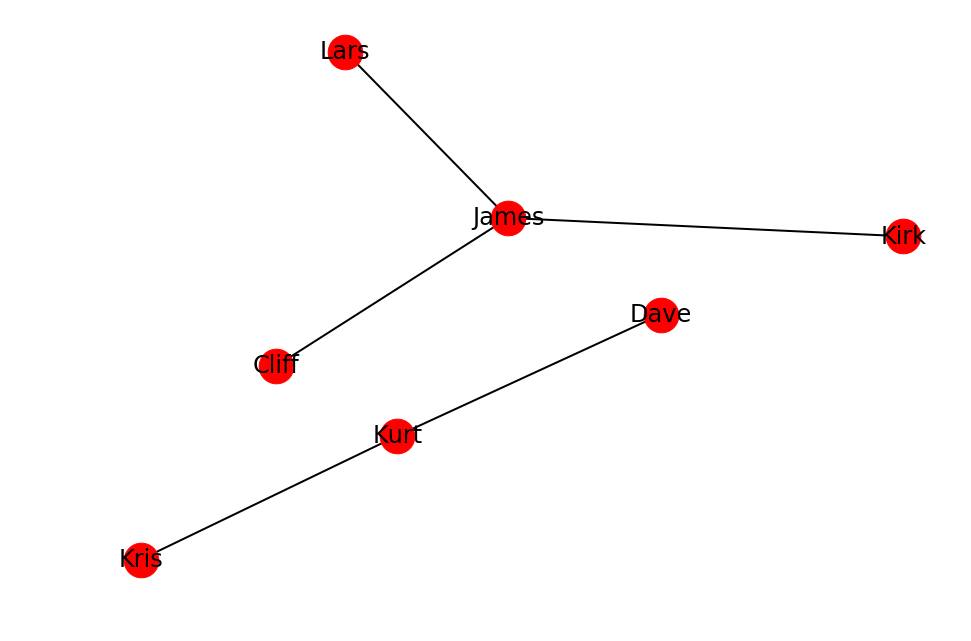
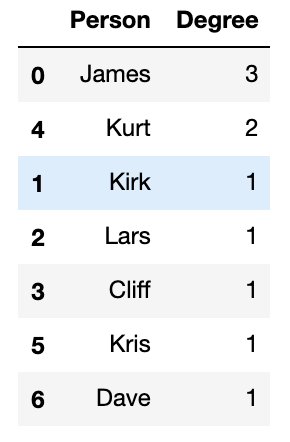
In this example above - there are seven people (nodes) in this network and five connections (edges). We can see that the network consists of two smaller, ‘sub’ networks with James being the most connected in one network and Kurt being most connected in the other. When we look at the degree of James and Kurt we have 3 and 2 respectively. James has three connections and Kurt has two. In this scenario, James and Kurt are the two most well connected individuals in the network.
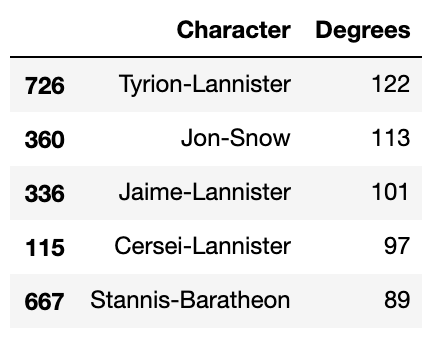
Now let’s explore this concept with the Game of Thrones data. As we can see, some of the characters with high degrees are indeed some of the more well known characters from the series. These are characters that have connections with many other characters in the saga.
Let’s plot the GoT graph again, but make the size of each node relative to the degree each character has.
(The number of edges coming from each node is the degree but representing this visually using size makes it easier to pick out characters with higher degree.)
(to navigate around the plot click and drag an area to zoom in. Double tap or double click to zoom out again)
Exploring what Betweeness Centrality is
Another important feature of a network which helps us to understand how important some nodes are in the network is a node’s betweeness centrality. In simple terms this is the extent to which individual characters are able to ‘bridge’ other parts of the network. Let’s explore this with our example from before.

Earlier on we found that James and Kurt had the highest degree i.e. these two people had the most connections with other nodes in the network. What happens if we introduce a seventh node linking James and Kurt?
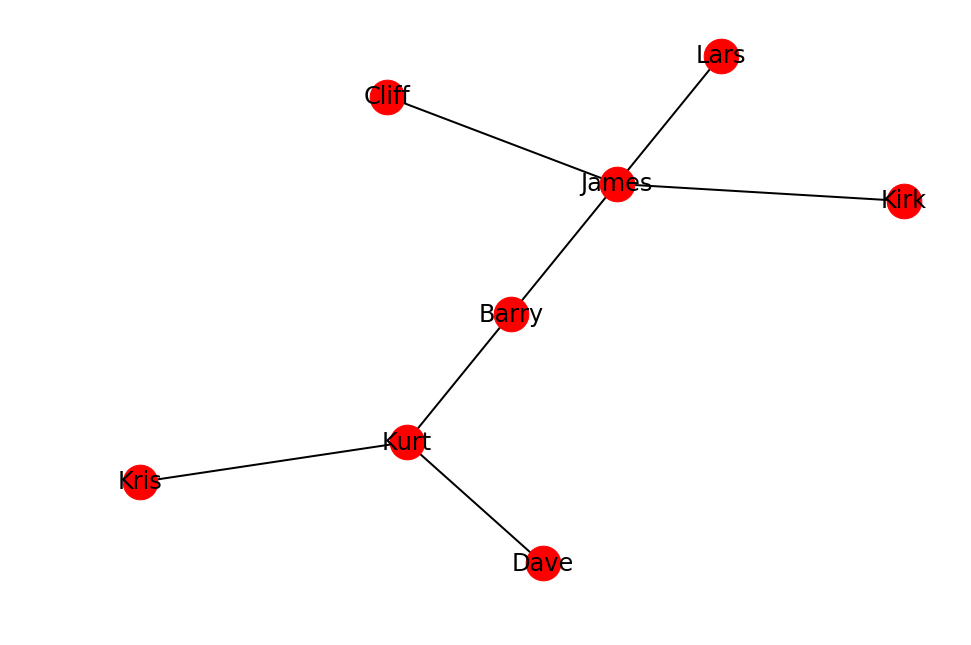
As expected James has four degrees, Kurt has three and Barry has two.
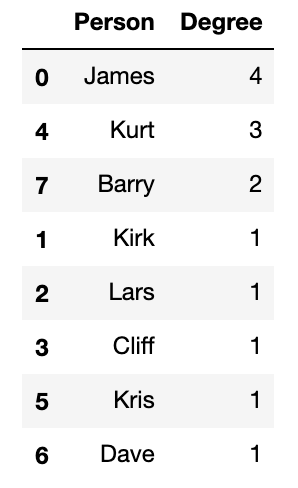
However Barry is important in that he bridges the two previous groups. This ability can be described by a node’s betweeness centrality, and as we can see - whilst Barry has fewer degrees than Kurt (is directly connected to fewer individuals) , his centrality in the network is higher.
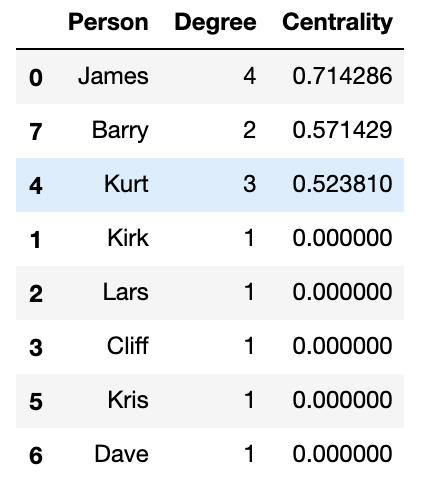
So to recap - whilst the number of connections (degree) a node has can help to describe how important a node is within the network, betweeness centrality is also important as it describes a node’s ability in connecting the network.
Are Degree and Betweeness Centrality correlated?
In the case of our GoT data, yes - there is a fairly strong correlation between Degree and Betweenness Centrality. The more individuals that a character is connected to, the more likely they are to connect the network as a whole.
However, there are a couple of skews that buck this trend as you can see in the plot below. Relative to the number of connections they have to all other characters, both Theon Greyjoy and Daenerys have higher betweeness centrality than we might expect. This means they have more storylines that involve parts of the network that are less connected. This makes sense. Danny spent a lot of time in the desert with the Dothraki’s and later on in Meerreen. Theon is more interesting - perhaps he is one of the few characters linking up the Iron Island storylines with the rest of Westeros?

Let’s visualise the GoT network with node size representing a nodes betweeness centrality.
(to navigate around the plot click and drag an area to zoom in. Double tap or double click to zoom out again)

Using network science to answer questions about the story
Which character pairings occur most often?
So now we know that nodes represent characters and edges represent the connection between characters. The weight of an edge indicates another feature of the node/edge relationship.
In our earlier London Underground example the weight of an edge could represent how many people take a specific journey between two stations in a given day. In this example, you would expect that the weight of the edge connecting London Bridge and Waterloo would be much higher compared to say the weight of the edge represented by the connection between stations further from central London e.g. Morden and South Wimbledon. After all there are usually more people travelling between stations in zone 1 than the stations in zone 6.
Weights give us more information about how nodes are connected with one another in a network
We can apply this same principle with our character data from GoT. The weights in our character data represent how many separate instances in the story two characters have shared with one another. An edge with a low weight represents an edge between two characters that have had fewer instances connecting with one another. Contrastingly, an edge with a high weight represents two characters that have encountered each other many times.
Let’s look at the edges with the biggest weights i.e. character pairings that occur frequently.
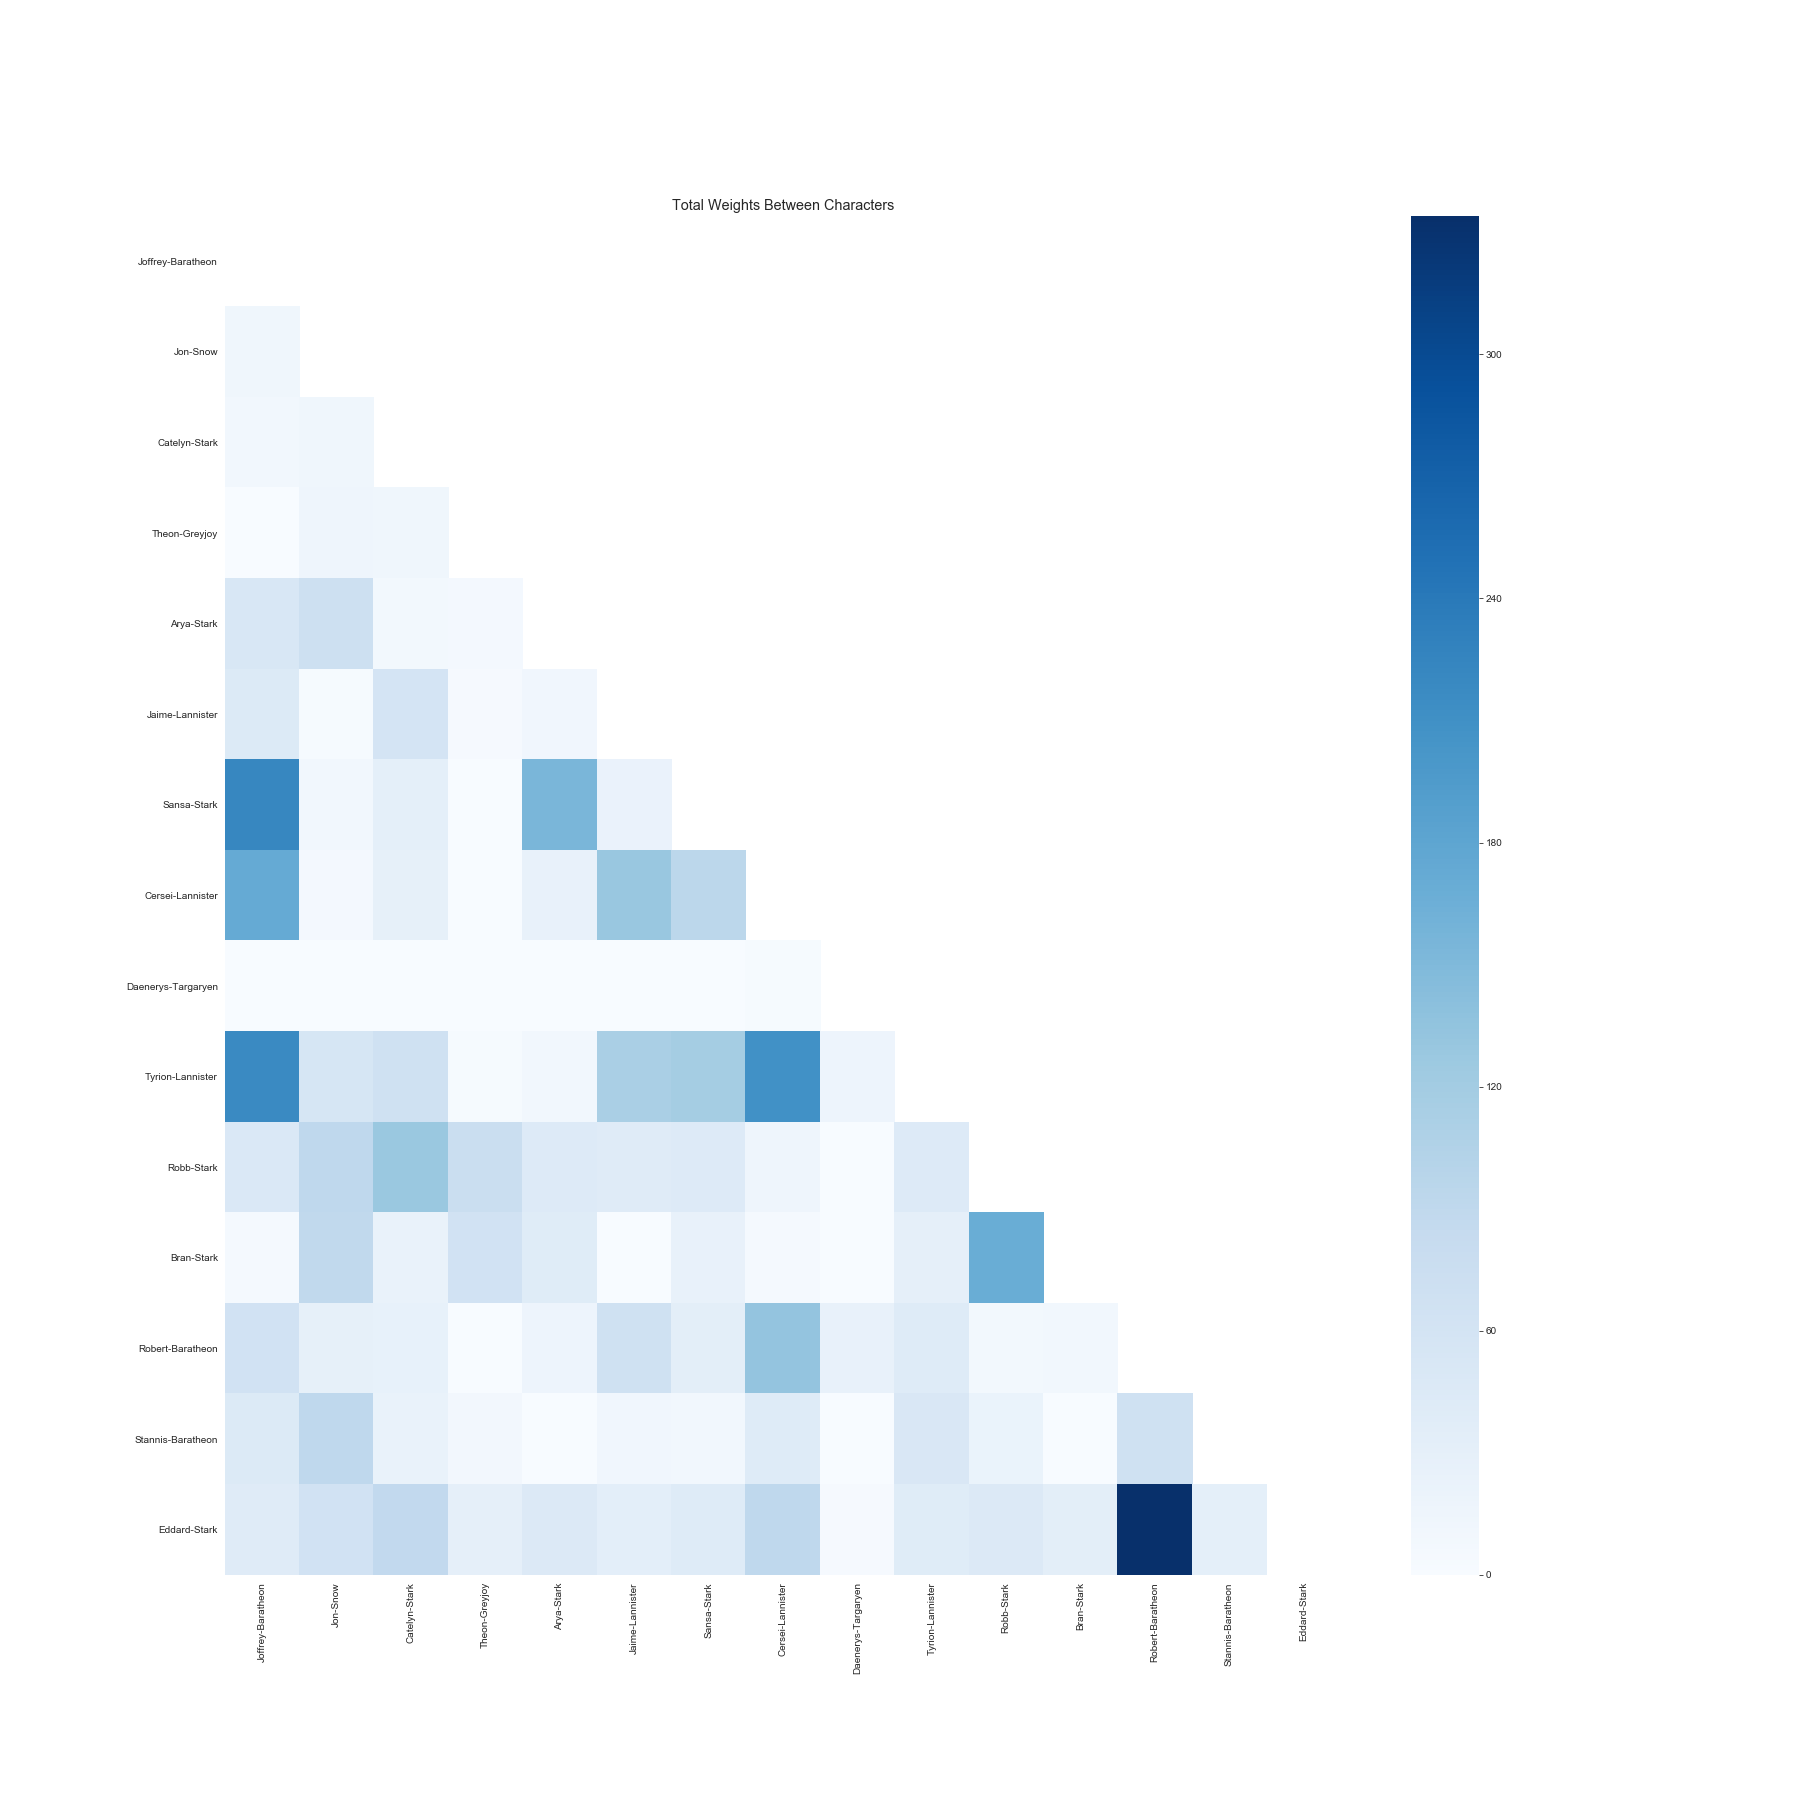
The connection between Ned and Rob has the biggest weight. This is a relationship that is represented by many interactions.

We can try and find a way to present this data in a more interesting way - a heatmap representing the adjacency matrix of the graph would work well.
Who are the most ‘visible’ characters?
Each character’s interaction with another character has a weight and as we have explored above the more frequent those interactions occur, the weight of that connection increases.
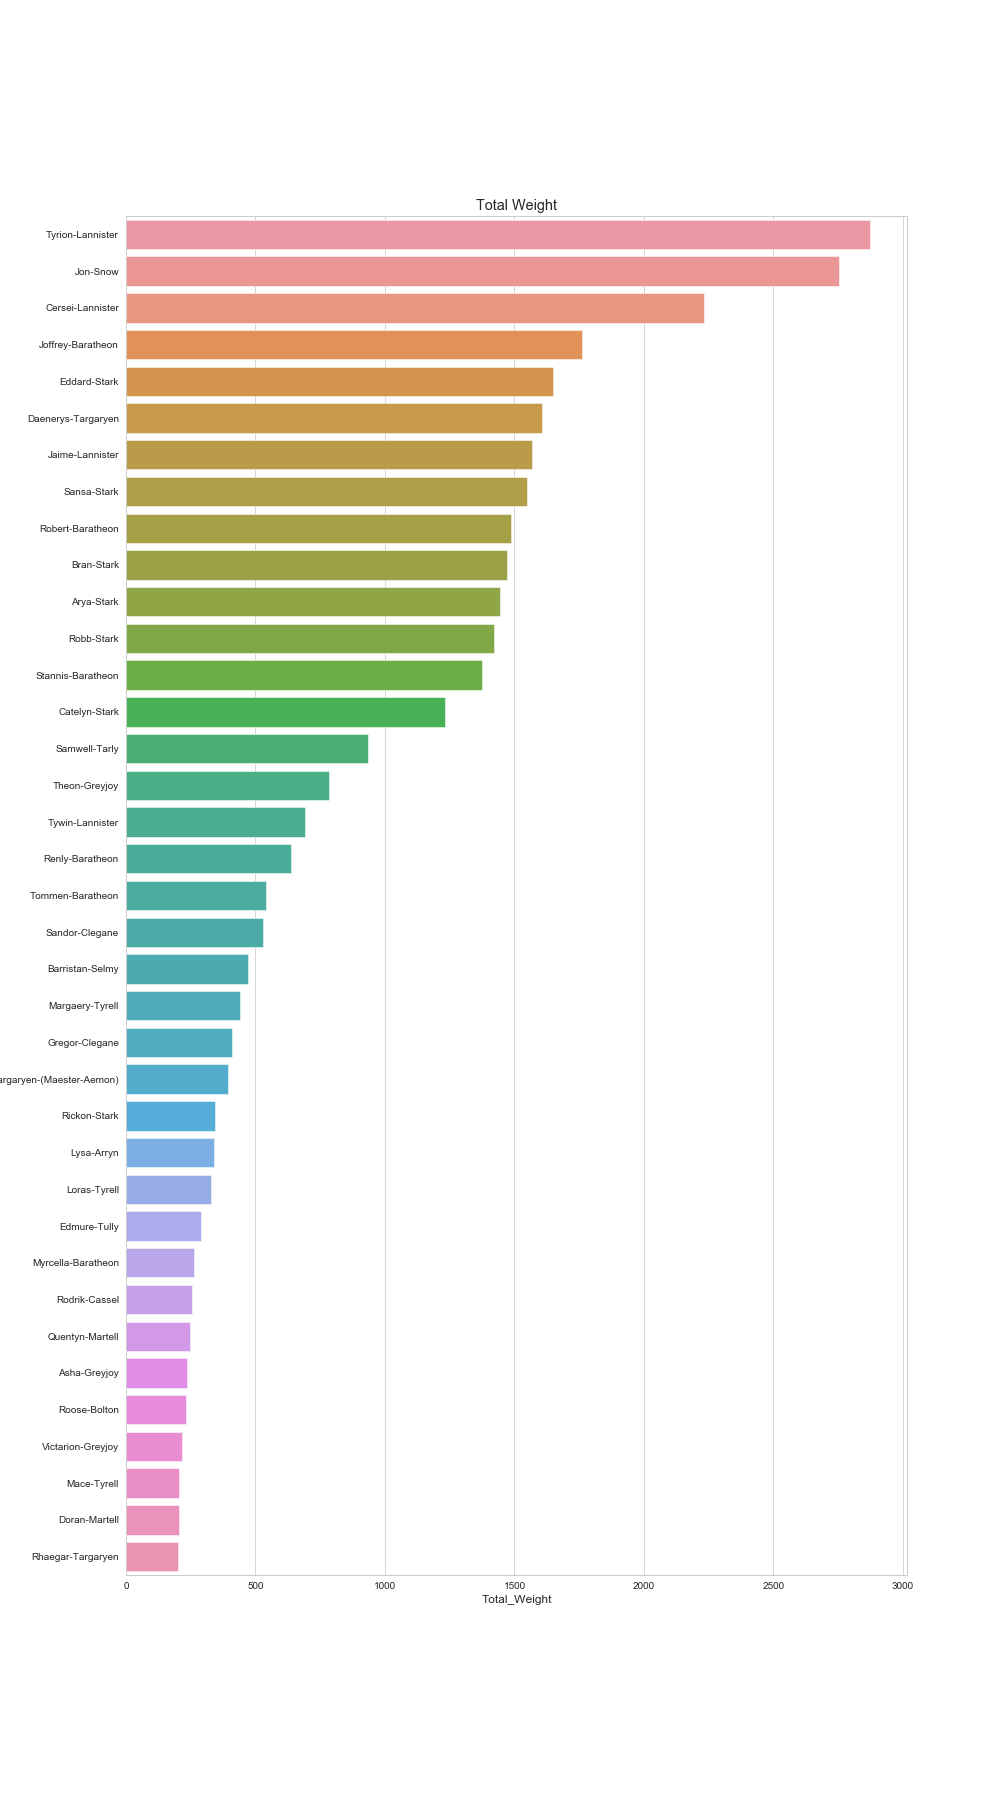
If we sum the total weights associated with each character we can get to a position where can understand a character’s total weight in the story. It is a number that reflects the sum of every individual interaction a character has. In some ways a measure of presence/visibility across the network.
Below is a plot of all characters with a degree of 200 or higher and then their total weights shown. Tyrion, Cersei and Jon-Snow top the chart.
Who are the most ‘devoted’ characters?
As we’ve seen, the total weight for each character represents the total volume of interactions a character has made with all other characters across the network and is generally correlated with the degree of the character.
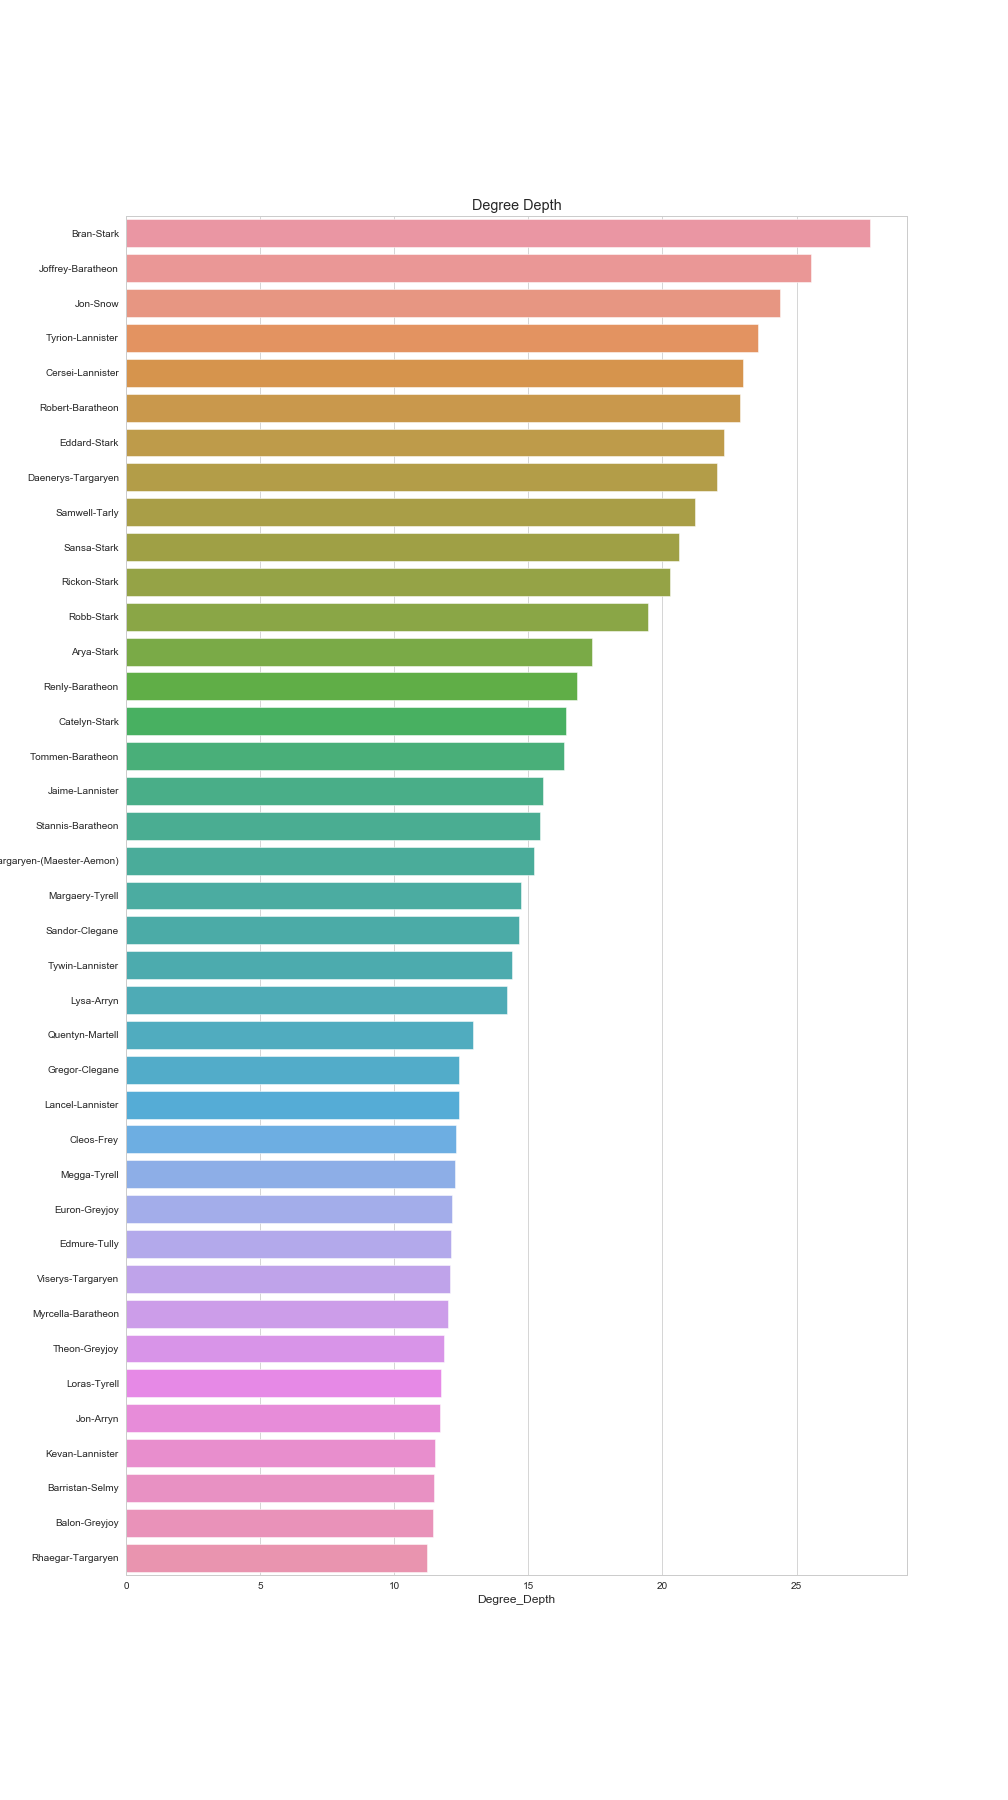
If we explore the ratio between the total weight a character has and how many character interactions they have made (i.e a character’s degree) we can explore another dimension of each character. For example, if a character has lots of interactions with few characters this could be an indicator of someone very ‘committed’. On the other hand, those characters that have few interactions with lots of characters could be described as having lots of acquaintances.
Bran Stark tops the list of characters when it comes to the degree depth. His high degree depth tell us that he commits more of his interactions (total weight) to fewer characters (degree).
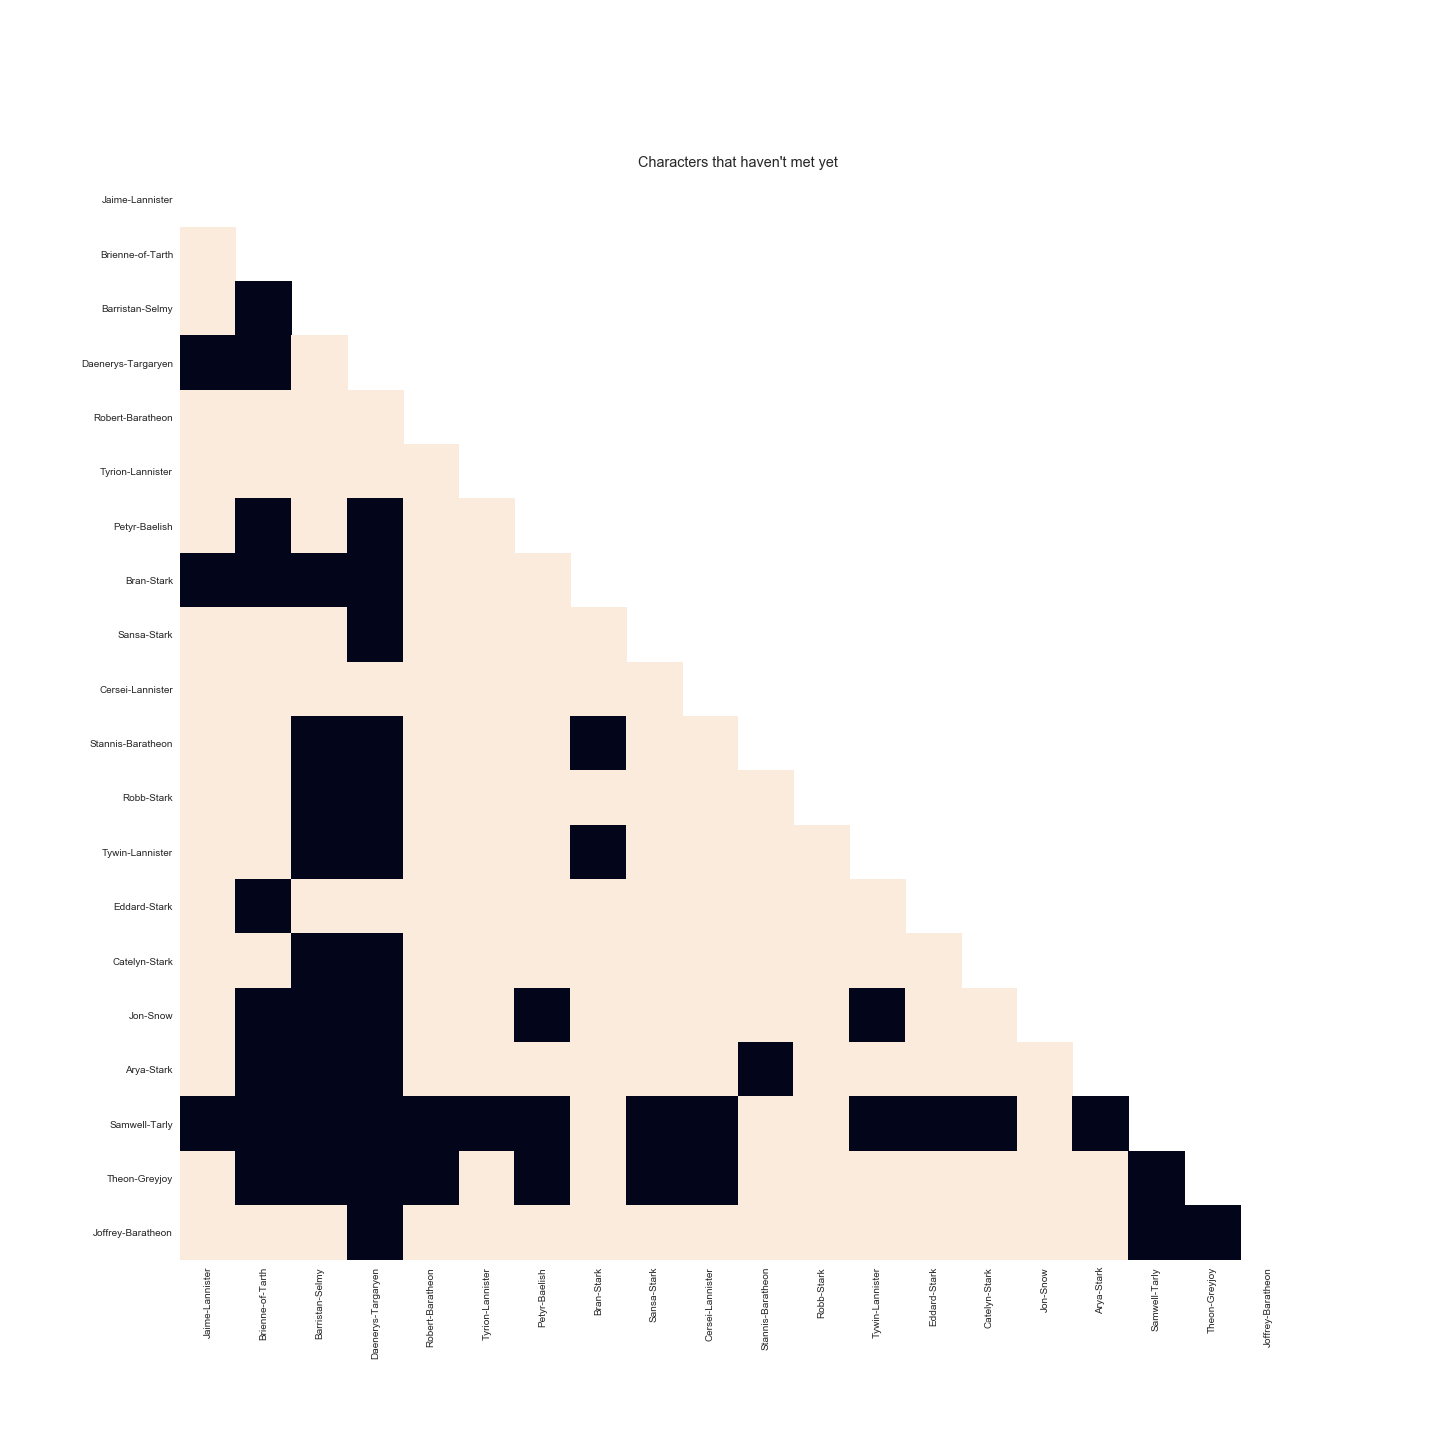
Which significant characters are yet to meet?
We can use the network to work out all the significant characters that haven’t actually met yet. After all, the sum of nodes far exceeds the highest degree in this network which means that there are many characters that haven’t got a narrative connection yet.
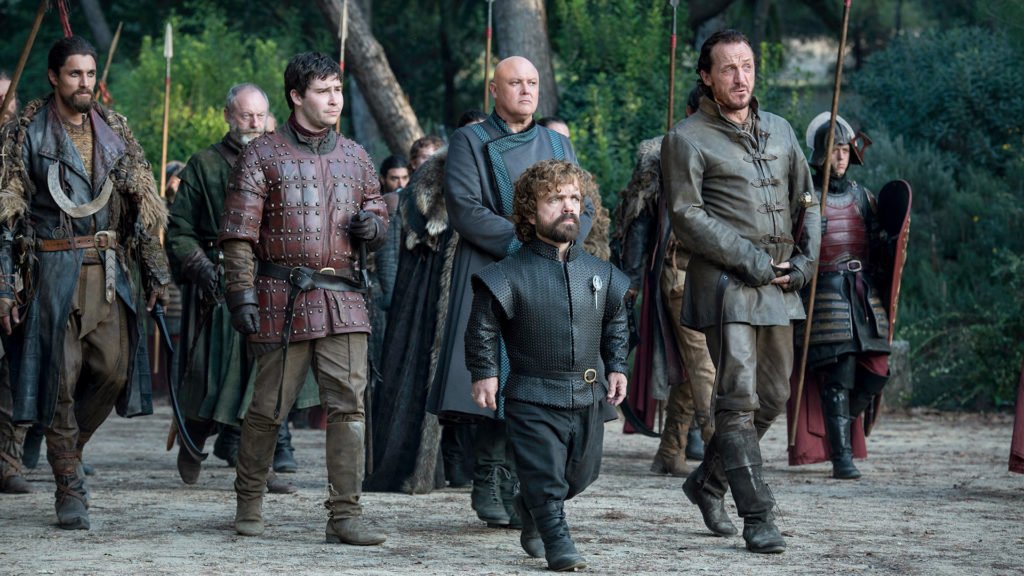
(Note, if you’ve been following the TV adaptation of GoT then there was a pivotal scene in season 7 where many key characters finally met after years of separate storylines . However in the books, many of these characters haven’t met yet, so you have to bear that in mind when you see the output from the analysis below)
In the matrix below - any connection that is yet to take place in ASOIAF is coded as black.
Summary
As I have hopefully shown, using network science can be a very useful and quick way to quantify and visualise how characters are connected in a story. It can tell us which character connections occur most frequently and which characters are most important in linking up the wider narrative. There are a number of ways I can evolve this project:
Other character dimensions
What would be useful in future iterations of this is to add extra dimensions that describe the nature/sentiment of some relationships. The weight of the Jon-Snow/Samwell-Tarly relationship (228) is roughly the same as Jorrey-Baratheon/Sansa-Stark relationship (222) but if you’re familiar with Game of Throne, they’re fundamentally different in sentiment! A key dimension of most stories is the interplay between antagonist and protagonist; the clash of good and evil. Currently my analysis doesn’t explore this. This is something that would be really interesting to explore in a future iteration of this study.
Different story types
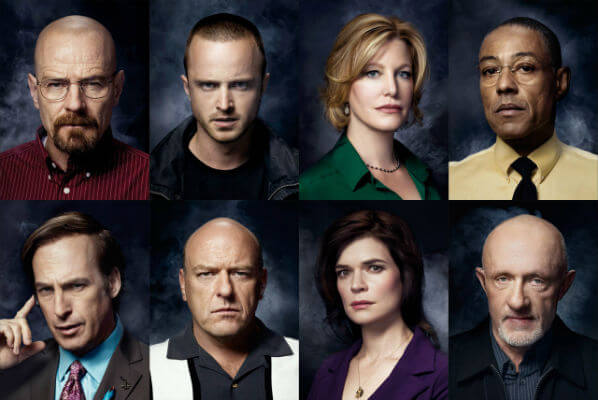
It would be interesting to run this kind of analysis on other kinds of stories and visualise their differences using similar graph plots. Another story that is almost as big in scope would be something like the Wire, or we could go much smaller and look at something like Breaking Bad.

Different Domains
We can use network science to model all kinds of relationships, including those outside of fiction. We could easily use it to model the relationships found across social networks. We would have to define what we meant by a ‘story’. Maybe it could be anyone that mentioned a specific term e.g ‘Brexit’, in which case the story in this example becomes a community of Twitter users that have talked about Brexit. Within this community we could use similar graph techniques to identify which Twitter handles are most connected (e.g who follows who, who retweets who) and identify handles that are particularly important in linking the community. The possibilities are endless, you just need to clearly define what represents your ‘story’, who the characters are and then take it from there!